Educational Apps
Interactive Learning Tools for Statistics
Overview
I develop interactive web applications to help students visualize and understand statistical concepts. These tools are built with R Shiny and designed to make learning statistics more intuitive and engaging.
Probability Distributions
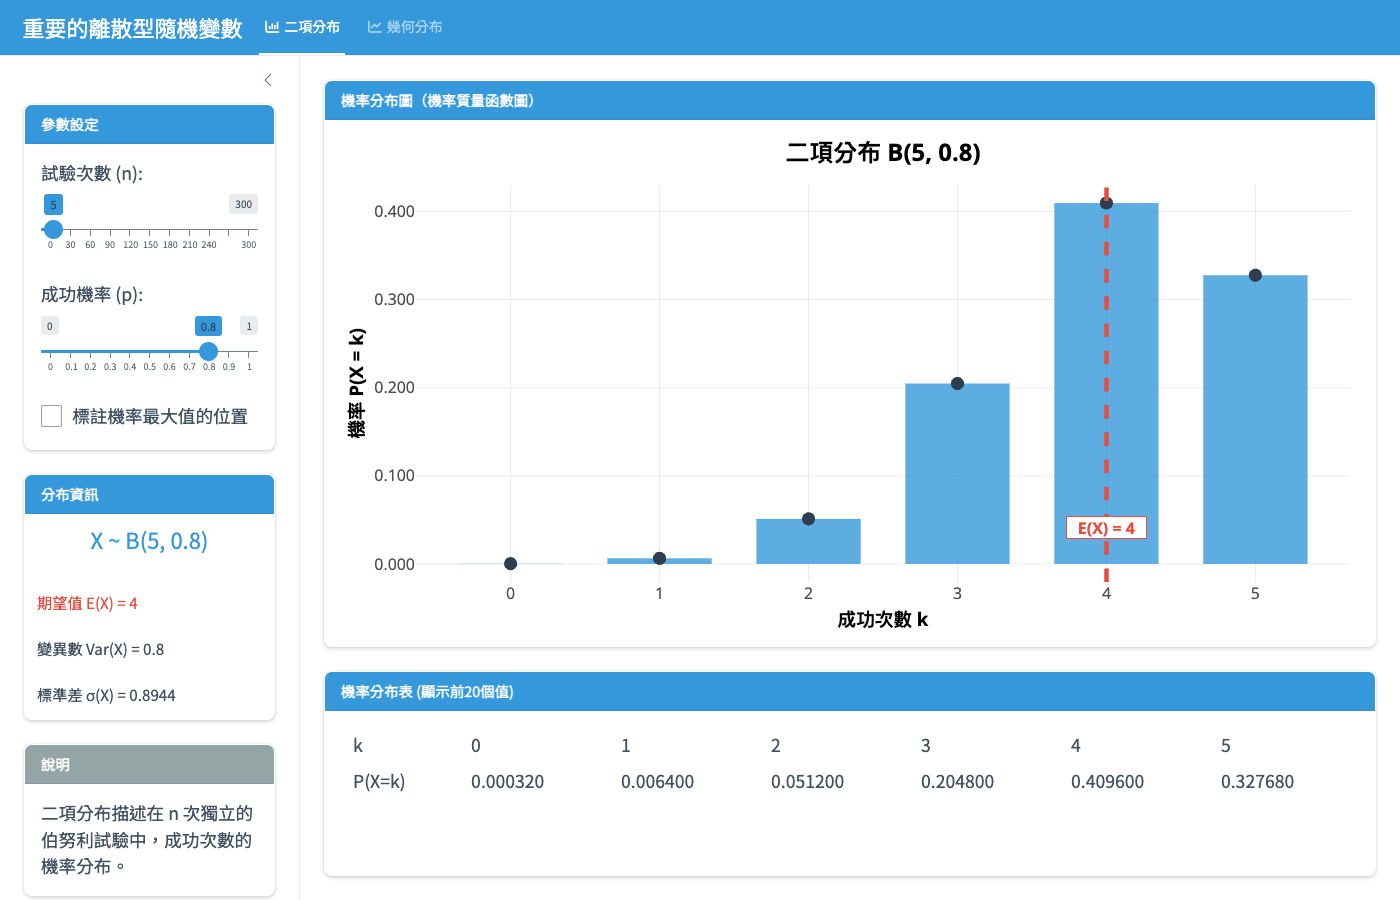
Discrete Probability Distributions
Interactive visualization of binomial and geometric distributions
An educational tool for exploring fundamental discrete random variables commonly taught in introductory statistics courses.
Features:
- Binomial Distribution: Visualize the number of successes across n independent trials
- Geometric Distribution: Explore the number of trials needed for the first success
- Adjustable parameters (success probability, number of trials)
- Probability mass function (PMF) graphs
- Probability distribution tables
- Maximum probability highlighting
Tech Stack: R, Shiny, Plotly, Bootstrap 5
Coming Soon
More educational applications are in development. Stay tuned!
- Continuous probability distributions
- Central limit theorem demonstration
- Hypothesis testing visualizer
About These Tools
These applications are designed to supplement classroom instruction and self-study. They aim to:
- Make abstract statistical concepts concrete through visualization
- Allow students to explore "what if" scenarios by adjusting parameters
- Provide immediate feedback on how distributions change
- Support both individual learning and classroom demonstrations
Feedback Welcome
If you have suggestions for new features or find any issues, please contact me.